#Background
When I studied at University of Minnesota, one of the first computer science classes I took was Introduction to Computer Science - one of the basic, entry level Python classes. Also during school, I was taking some math classes and decided to go for a mathematics minor just because I enjoyed the classes.
One of the most memorable projects I worked on that first semester was a python script that uses the visualization tool Turtle to simulate throwing darts at a 2-foot by 2-foot square board that contains 2-foot diameter (1-foot radius) circle inside of it. It would look something like this:
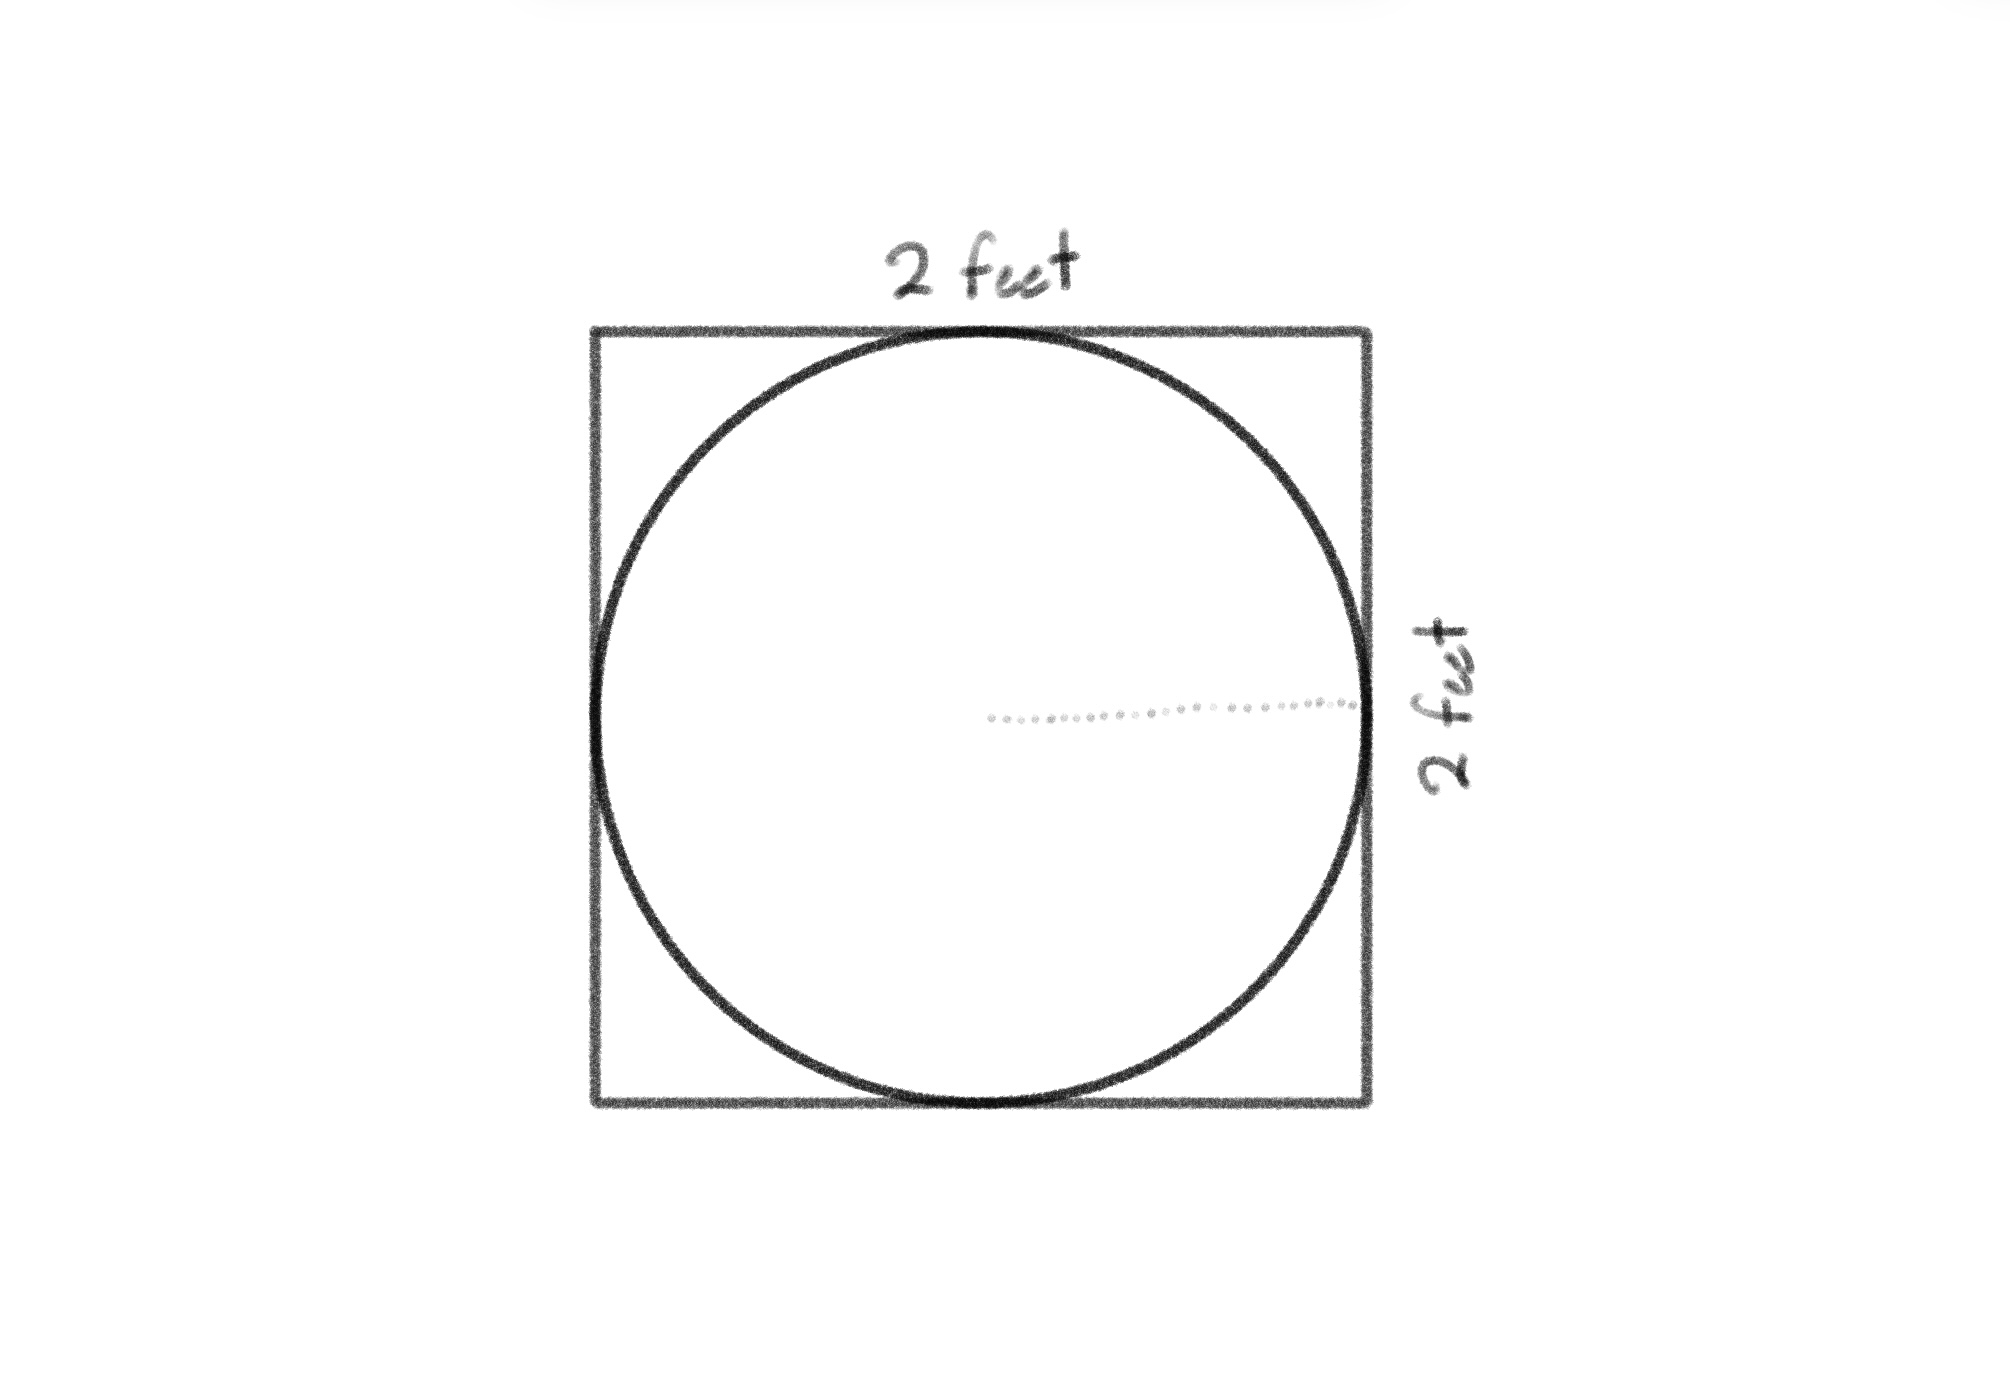
The idea was that if you throw enough darts at the board (all of which land in the 2x2 square), the number of darts in the circle divided by the total darts that hit the board would equal one quarter of Pi. This can be represented by something like:
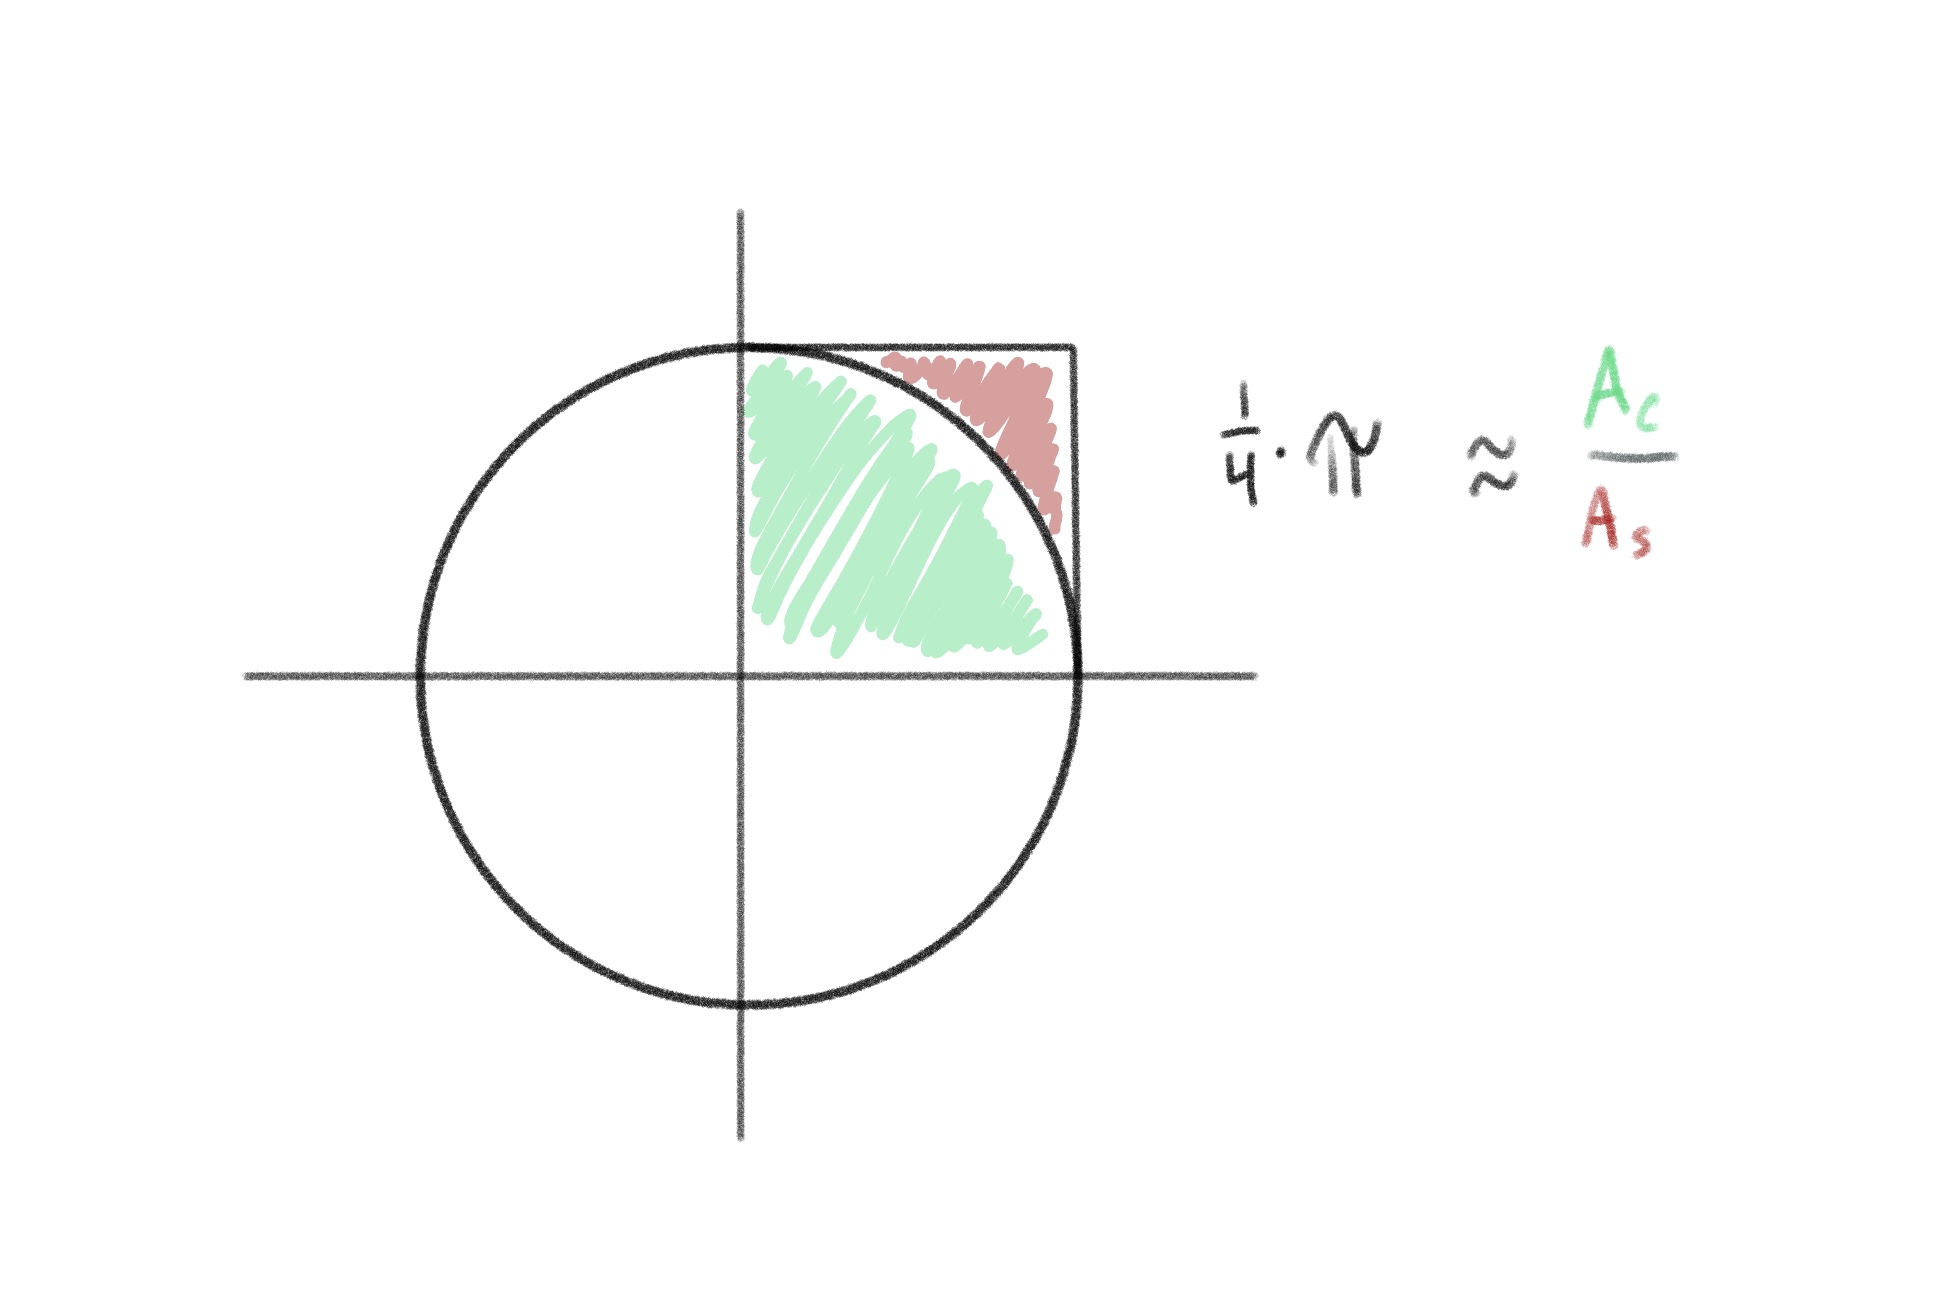
In order to truly calculate for the number Pi, you can rearrange the above calculation to look like:
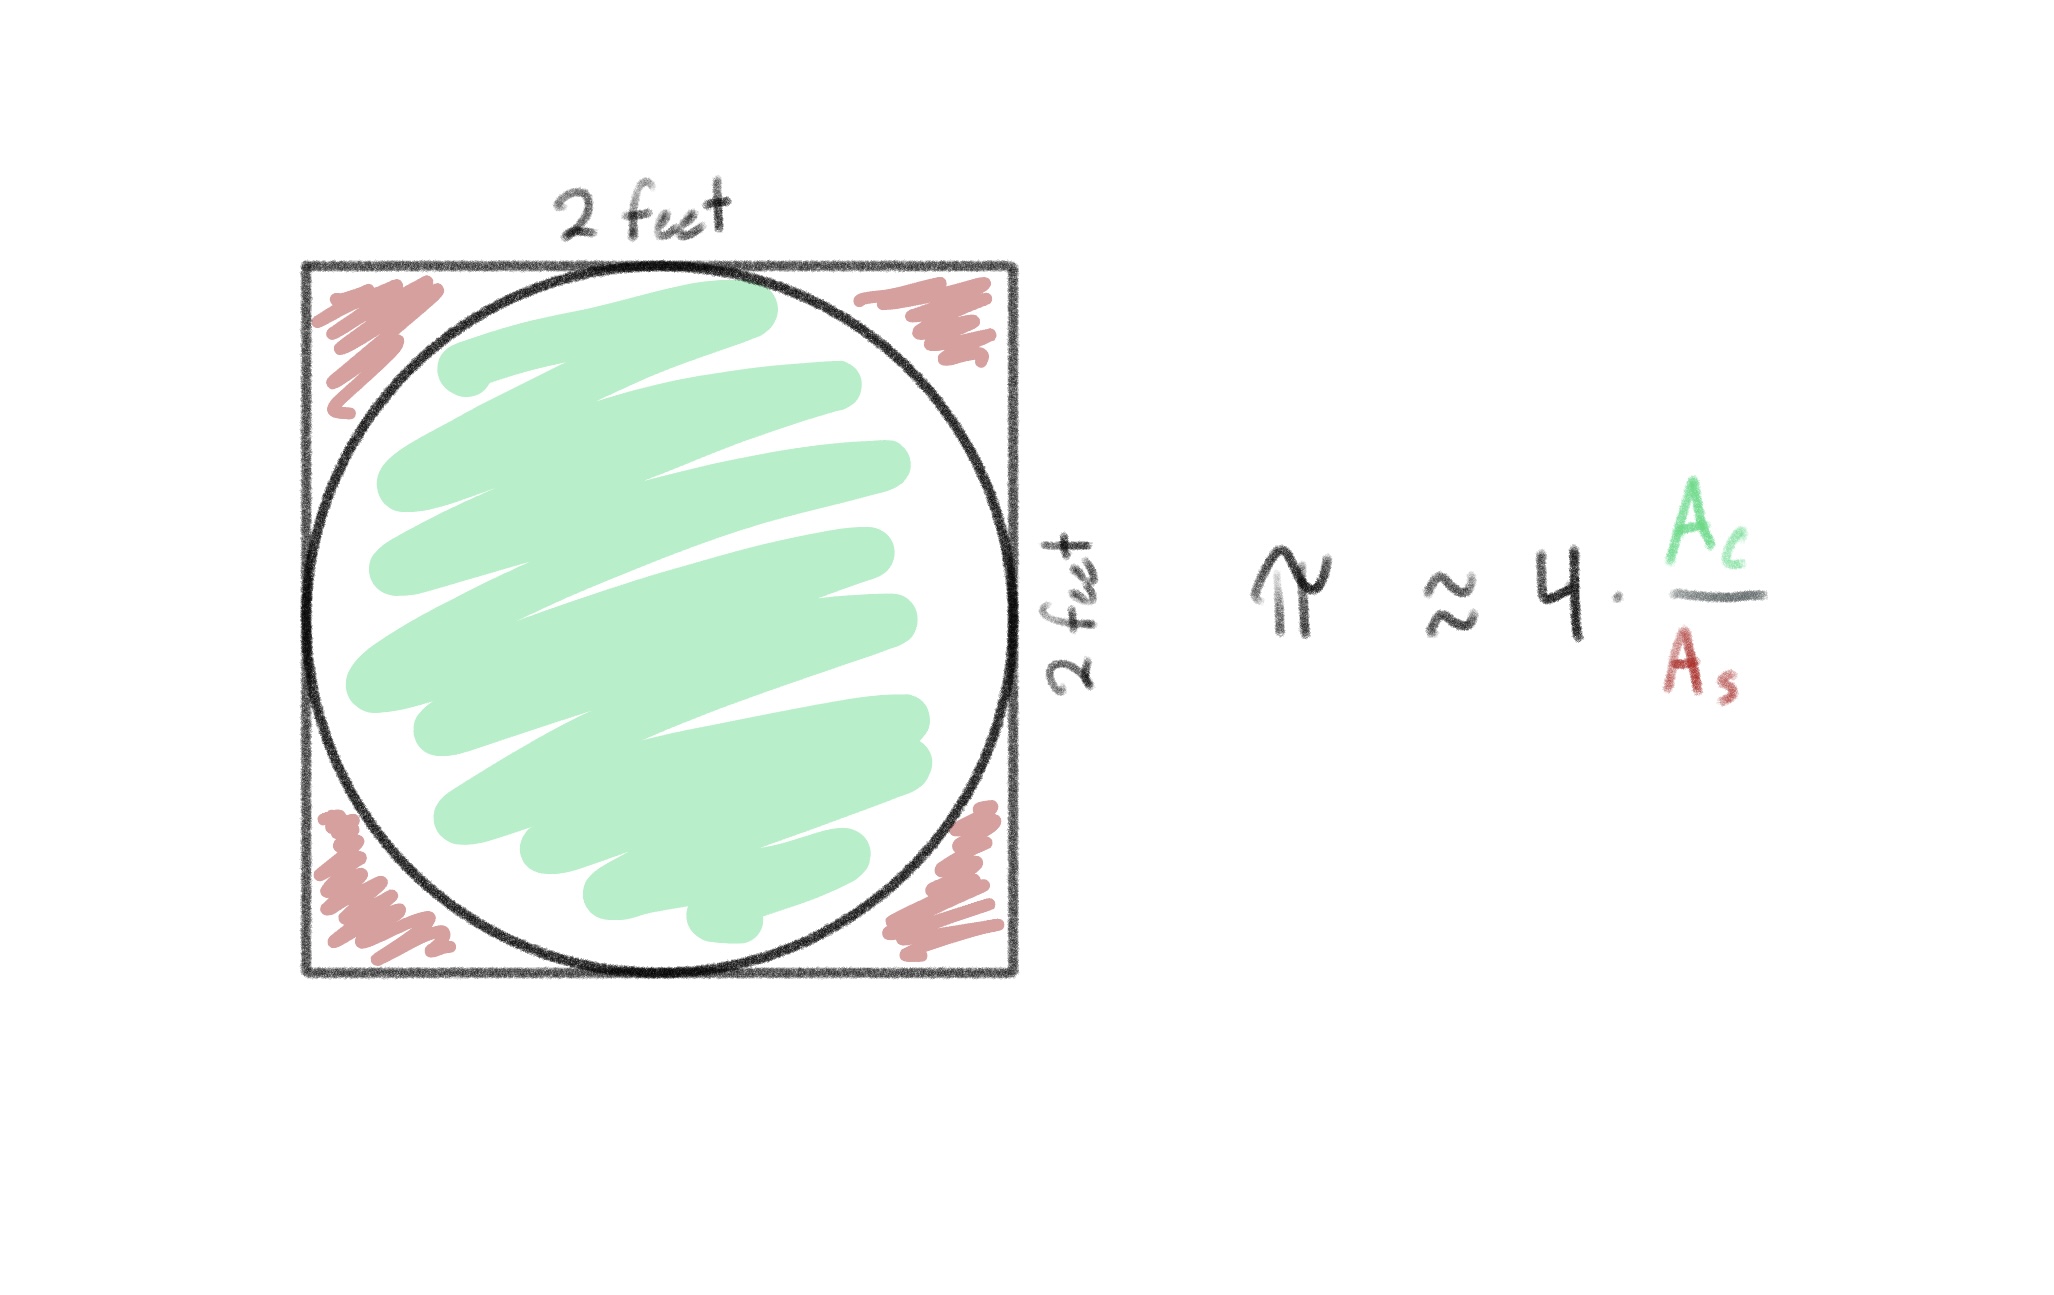
Now, if you throw 4 darts and 3 of which land in the circle, this calculation would look like (3 darts hit / 4 darts thrown) * 4 = 3,
which is not very far off from the number Pi we all love and know, but definitely needs to be closer to the irrational number
... but how can we make it closer??
#Monte Carlo Simulation
Monte Carlo simulations are basically a type of computational algorithm that uses repeated random sampling to calculate or generate some relevant statistic or mathematical answer. This method of estimating Pi is a very basic example of the Monte Carlo algorithm.
I wrote a very simple Python script that uses Turtle to visualize the darts thrown, calculates the positioning of the darts and the estimating of Pi after so many iterations. The script looks something like this:
import turtle
import random


def estimate_pi(iterations):
    turtle.penup()
    turtle.speed(0)

    darts_in = 0
    darts_total = 0

    for iteration in range(iterations):
        y_coordinate = random.uniform(-1, 1)
        x_coordinate = random.uniform(-1, 1)

        if (((x_coordinate ** 2) + (y_coordinate ** 2)) ** 0.5) <= 1:
            color = "green"
            darts_in = darts_in + 1
            darts_total = darts_total + 1

        else:
            color = "red"
            darts_total = darts_total + 1

        turtle.setpos(x_coordinate * 150, y_coordinate * 150)
        turtle.dot(5, color)

    pi_approx = 4 * (darts_in / darts_total)

    print("Pi is approximately: {0:.4f}".format(pi_approx))

    turtle.done()


if __name__ == '__main__':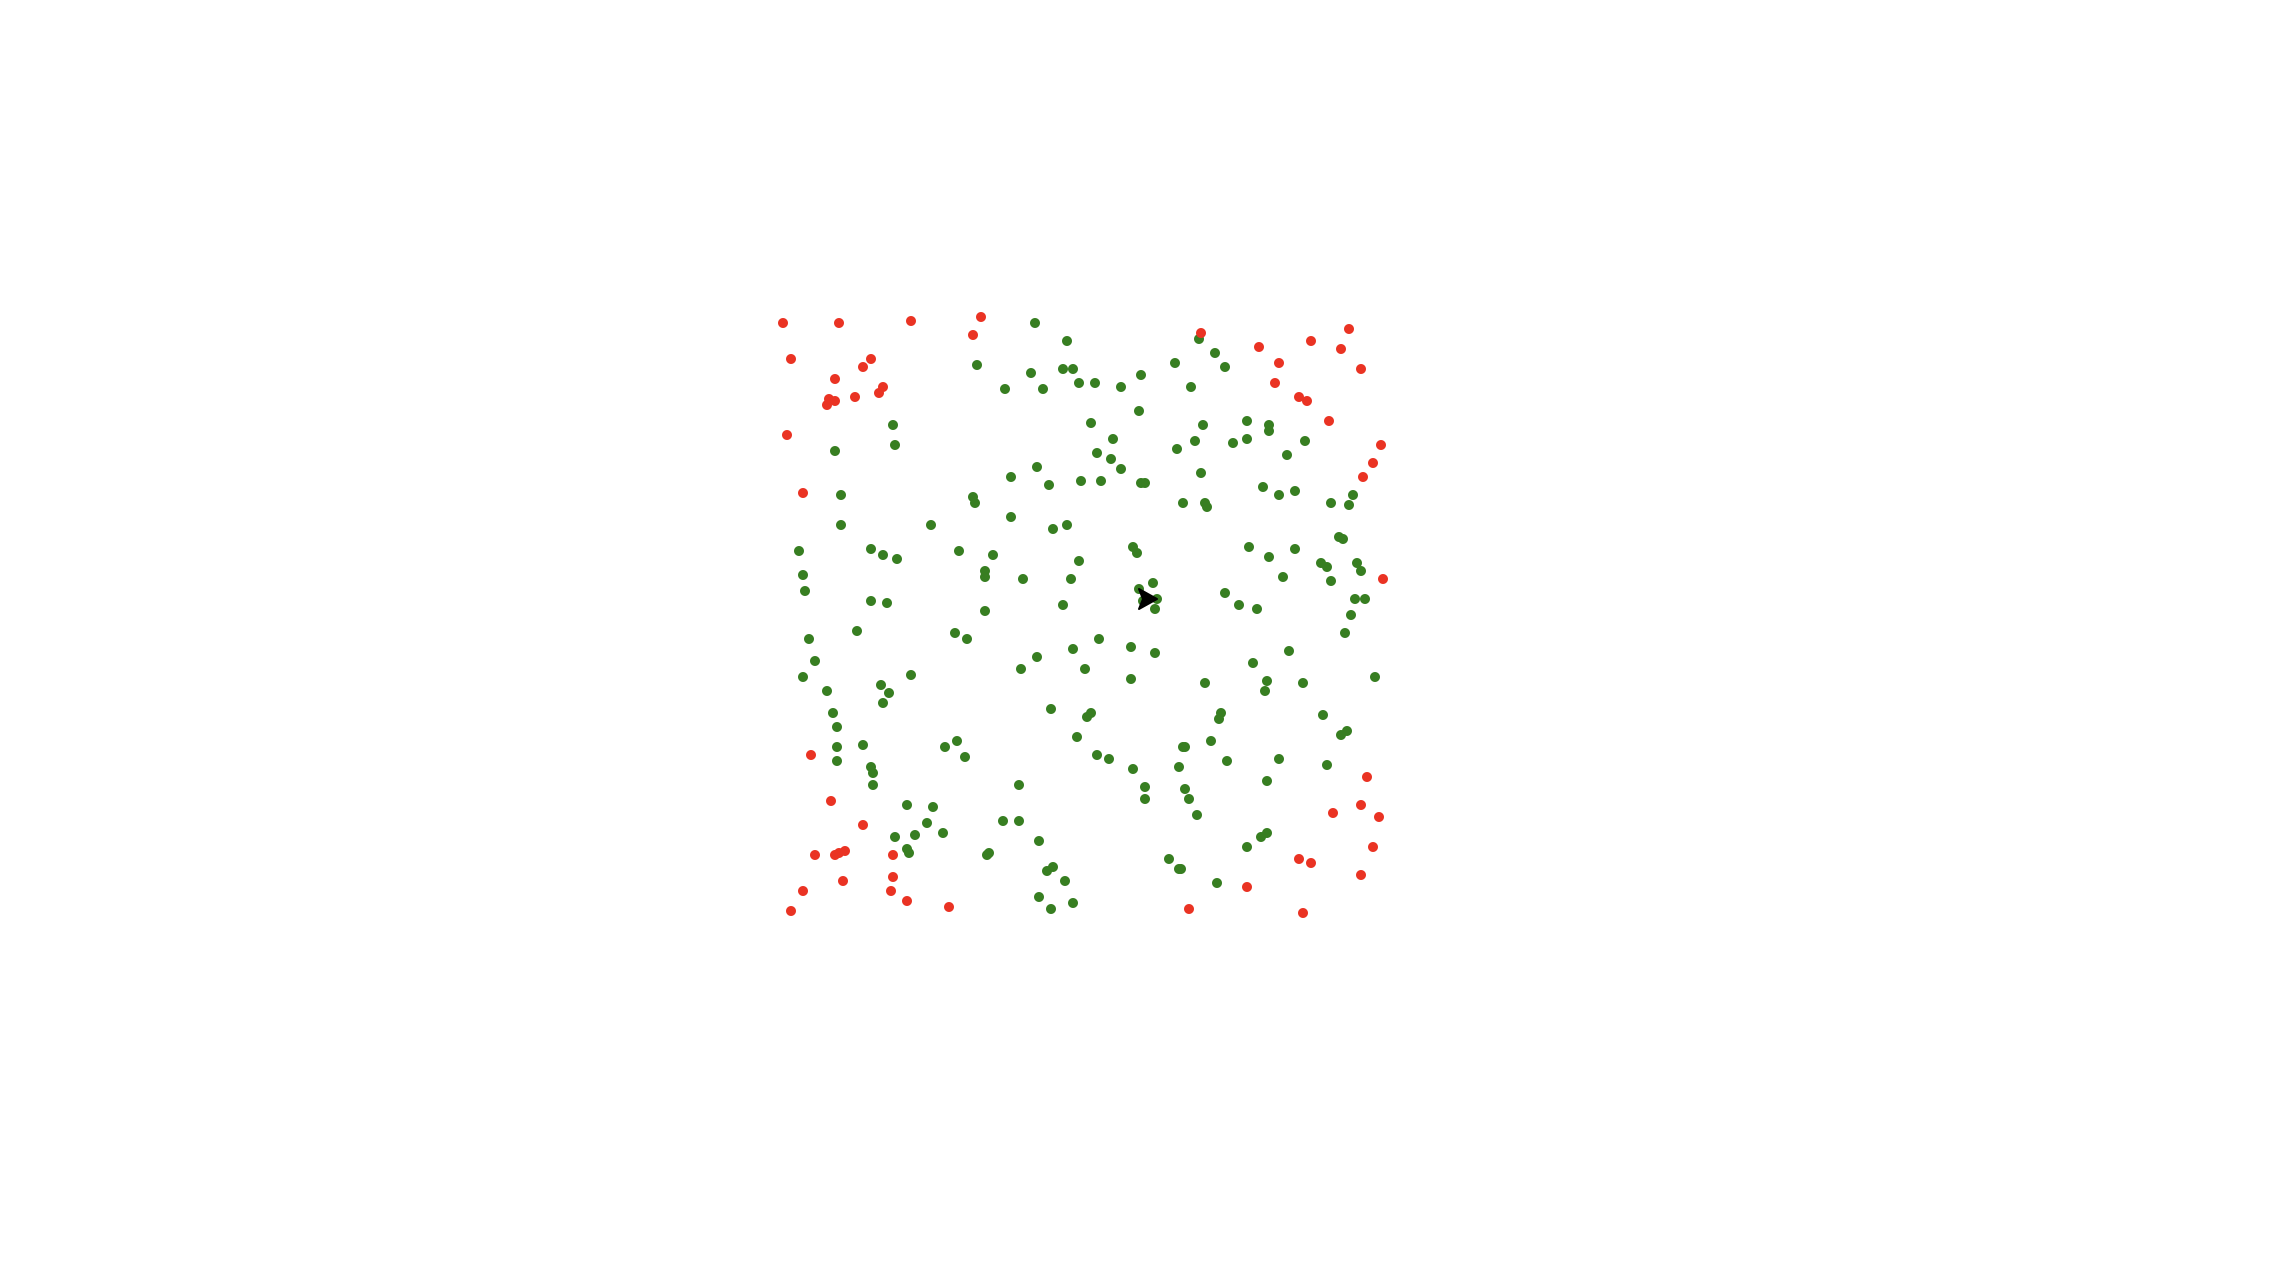
estimate_pi(250)The idea is, like mentioned above, is that a few random darts thrown at the board doesn't provide a very accurate representation of Pi, and thus, the python script would generate something like this:
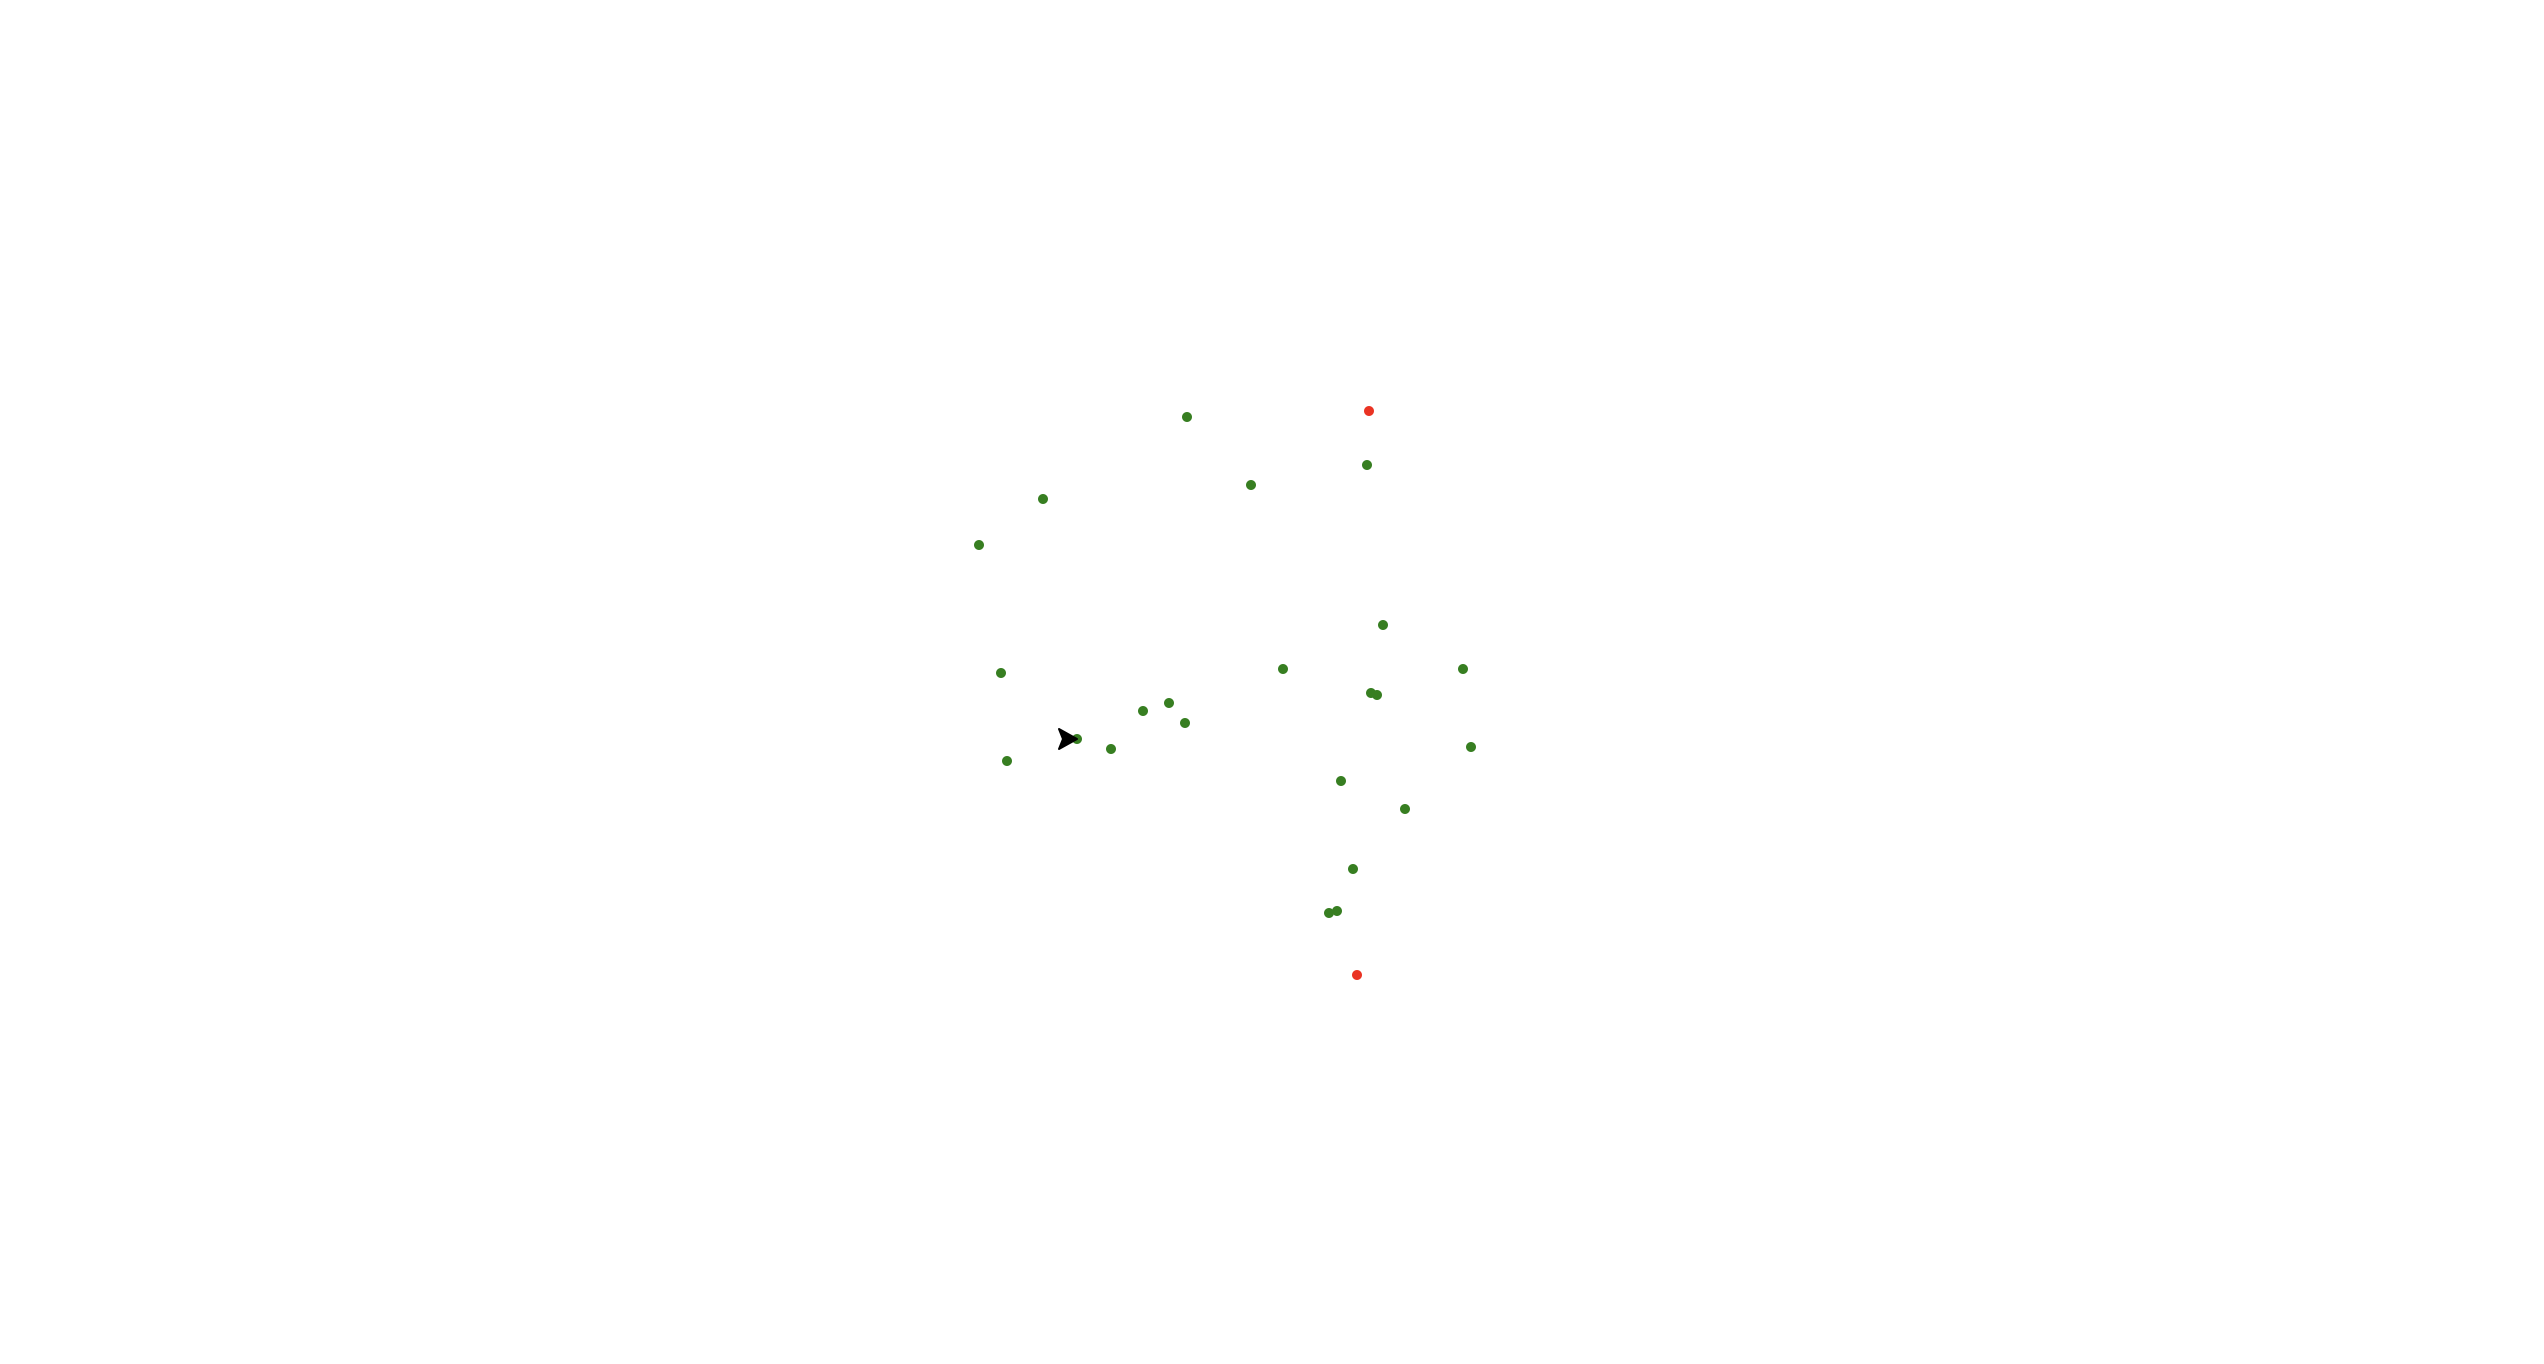
and prints out:
Pi is approximately: 3.5200Well, that's cool but that also doesn't seem very accurate. So, to really try and achieve accuracy let's bump up the number of iterations to 250 so we can get a closer estimation:
and prints out:
Pi is approximately: 3.1520#Results 🎉
All of that is kind of neat, but still not super accurate as you progress into higher degrees of accuracy, but, a fun thing to try is to crank up the iterations to work on estimating a number extremely close to Pi.
For example, when you visualize 25,000 darts thrown, the graph looks something like this:
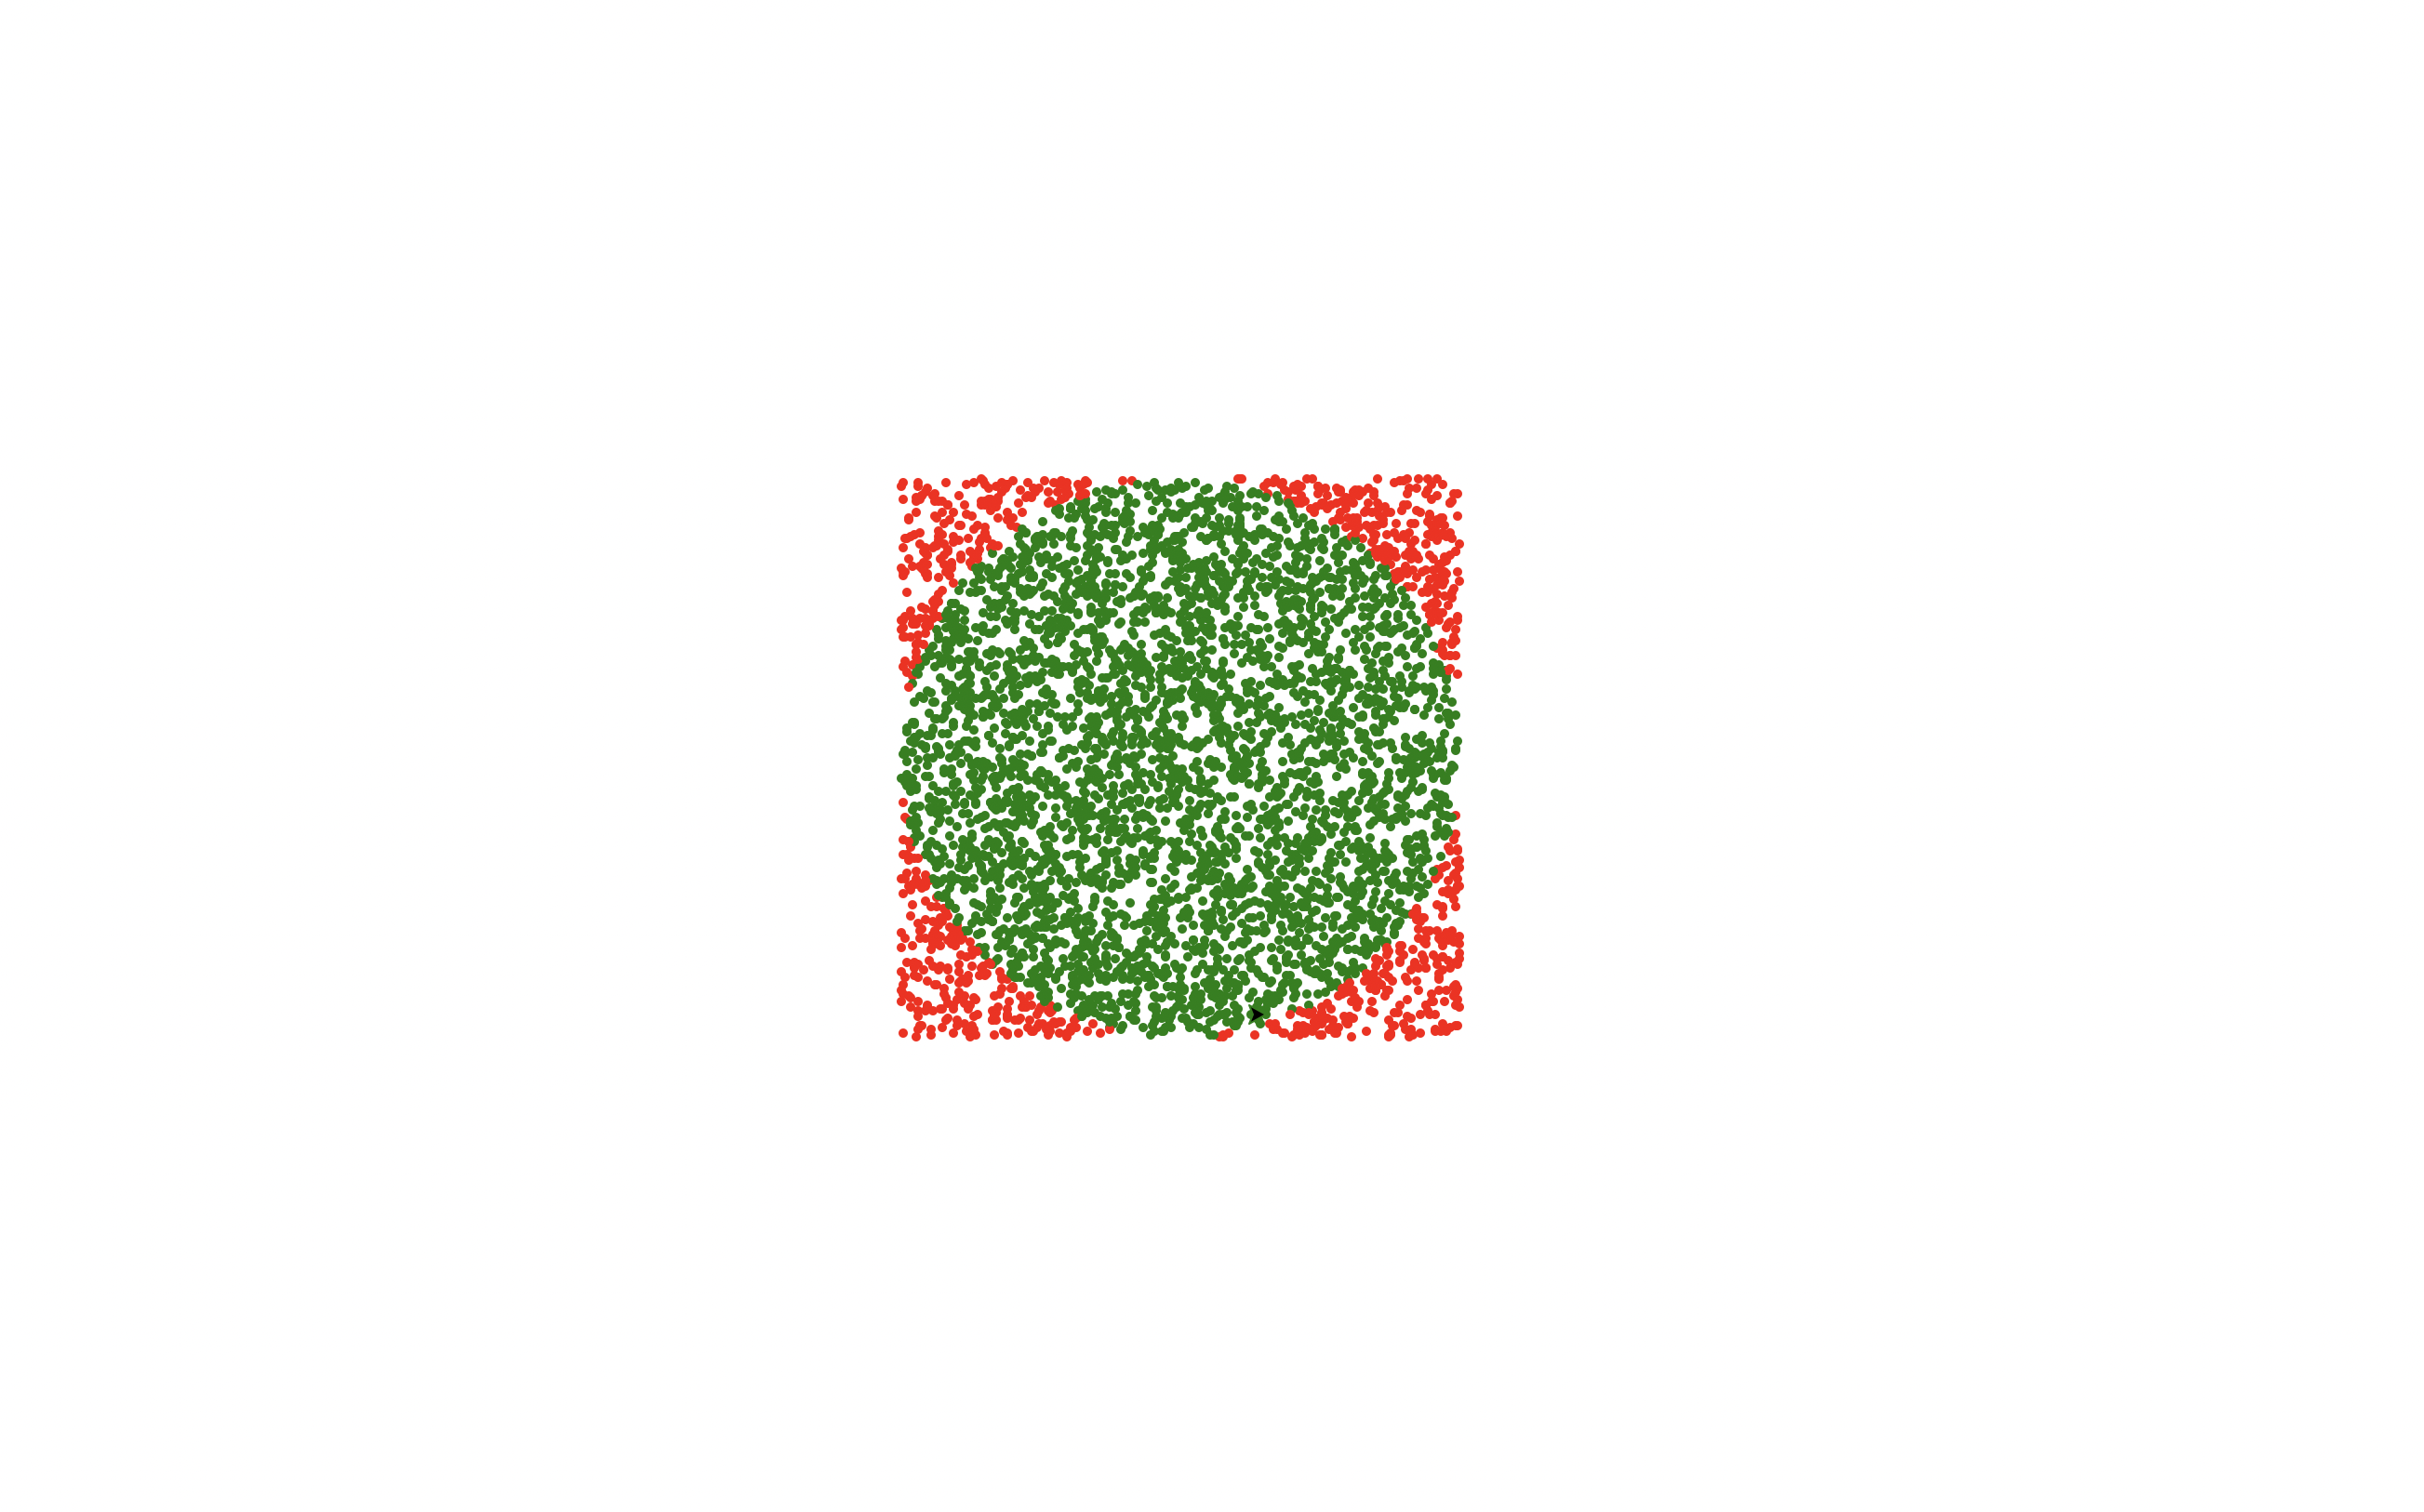
and prints out:
Pi is approximately: 3.14350400The primary limiting factor here is the time Turtle takes to run the visualization, so if you remove that code, you can easily iterate over millions of 'darts thrown' and print out more decimals.
I personally love this as it was one of the first things I learned in my degree and it's so cool that math can be visualized so easy with such a simple Python script. As always, the code can be found on my GitHub repository - feel free to clone and run locally, it's quite fun to mess around with.